

Do you need to improve your organization’s board and executive reporting?
It is critical that the chosen reporting method links to your business model, strategic direction and the environment.
Based on our experiences in working with boards and executives, an effective reporting framework will aim to address nine key questions:
- Where is the value being created and destroyed in our organization?
- What are the long-term margin trends in our businesses?
- What are the major risks to which the organization is exposed?
- What major projects are under way in the organization, and is implementation on schedule and on cost?
- What is the level of employee morale? What is the retention rate for our key people?
- Is our market share in key segments holding? What are the trends in customer satisfaction?
- What is happening to our corporate image?
- How does our strategy differ from that of our competitors in our major businesses?
- How is our organization viewed by external stakeholders?
A well-structured reporting framework enables directors and executives to answer these key questions.
Higher quality information is not necessarily synonymous with more information. Board and executive scorecards need to be designed to capture the most critical performance information at a single glimpse. The performance information contained in scorecards becomes seamlessly linked into more detailed performance operational dashboards via interactive visualization mechanisms such as hyperlinks.
Revenue Growth and Innovation Reporting Example
The following example highlights the revenue growth performance metric and the revenue growth and innovation dashboards level 1 and level 2.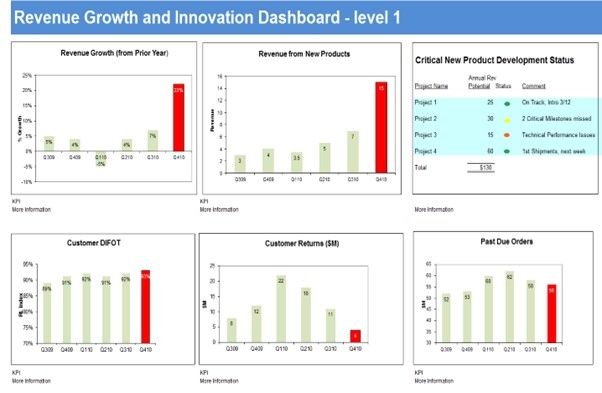
The level 1 dashboard is the highest reporting level for Revenue Growth and Innovation. This dashboard example highlights important performance metrics; revenue growth generated this year and the revenue from new products, released in the past three years. This level 1 dashboard example is reporting on lead and lag indicators.
The level 2 dashboard example highlights the relevance of revenue growth to the organization’s strategic objectives. In this example, the organization has set the strategic objective of 50% revenue growth over the next five years, which is to be achieved by developing new innovative products for its existing markets and diversification into new markets.
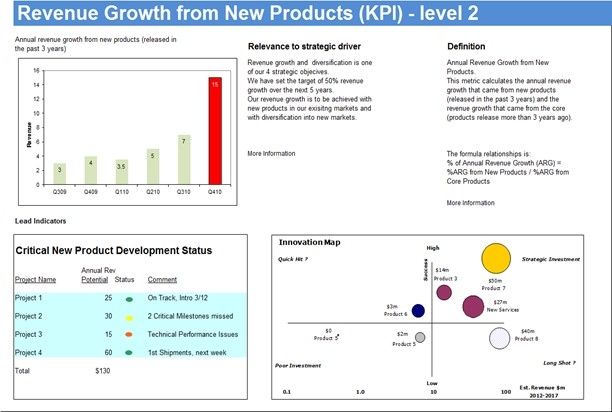
This level 2 dashboard example reports on the lead indicators of the innovation map and new product development status, which are key drivers for revenue growth over the next years.
Improving Board and Executive Reporting.
Organizations' can improve their board and executive reporting by:- Creating a corporate standard for reporting, scorecards and metrics based on best reporting practices.
- Developing board and executive scorecards that provide a top-down view of operations linking high levels of financial outputs to key operational drivers.
- Selecting performance metrics aligned to the strategy and value drivers, i.e., an explicit set of metrics for the board, board committees and the executive team (approx. 15 to 20).
- Linking reporting and metrics to strategy and the annual budget.
DOWNLOAD THE PDF
*Adapted from AICD Reporting to the Board 2009 and Colin Carter and Jay Lorsch; Back to the Drawing Board 2004
RELATED READS
RELATED READS
![[Block//SEO Page Title]](https://app.ontraport.com/images/opt_default_image.png "[Block//SEO Page Title]")
Turn your business case into an approval-ready decision pack.
